Role
Media Designer
Scope
Infographics, visual frameworks, interactive workshop materials, data visualization
Context
Translating subject matter expert content into clear, structured visuals
A large part of my work involves translating complex or abstract concepts into clear, structured visuals. Whether it’s turning a subject matter expert’s notes into a visual framework, designing a data-dense infographic, or creating interactive materials for a workshop, the goal is always the same: make the information easy to understand at a glance.
All examples below were created for PXT Academy programs at Amazon.
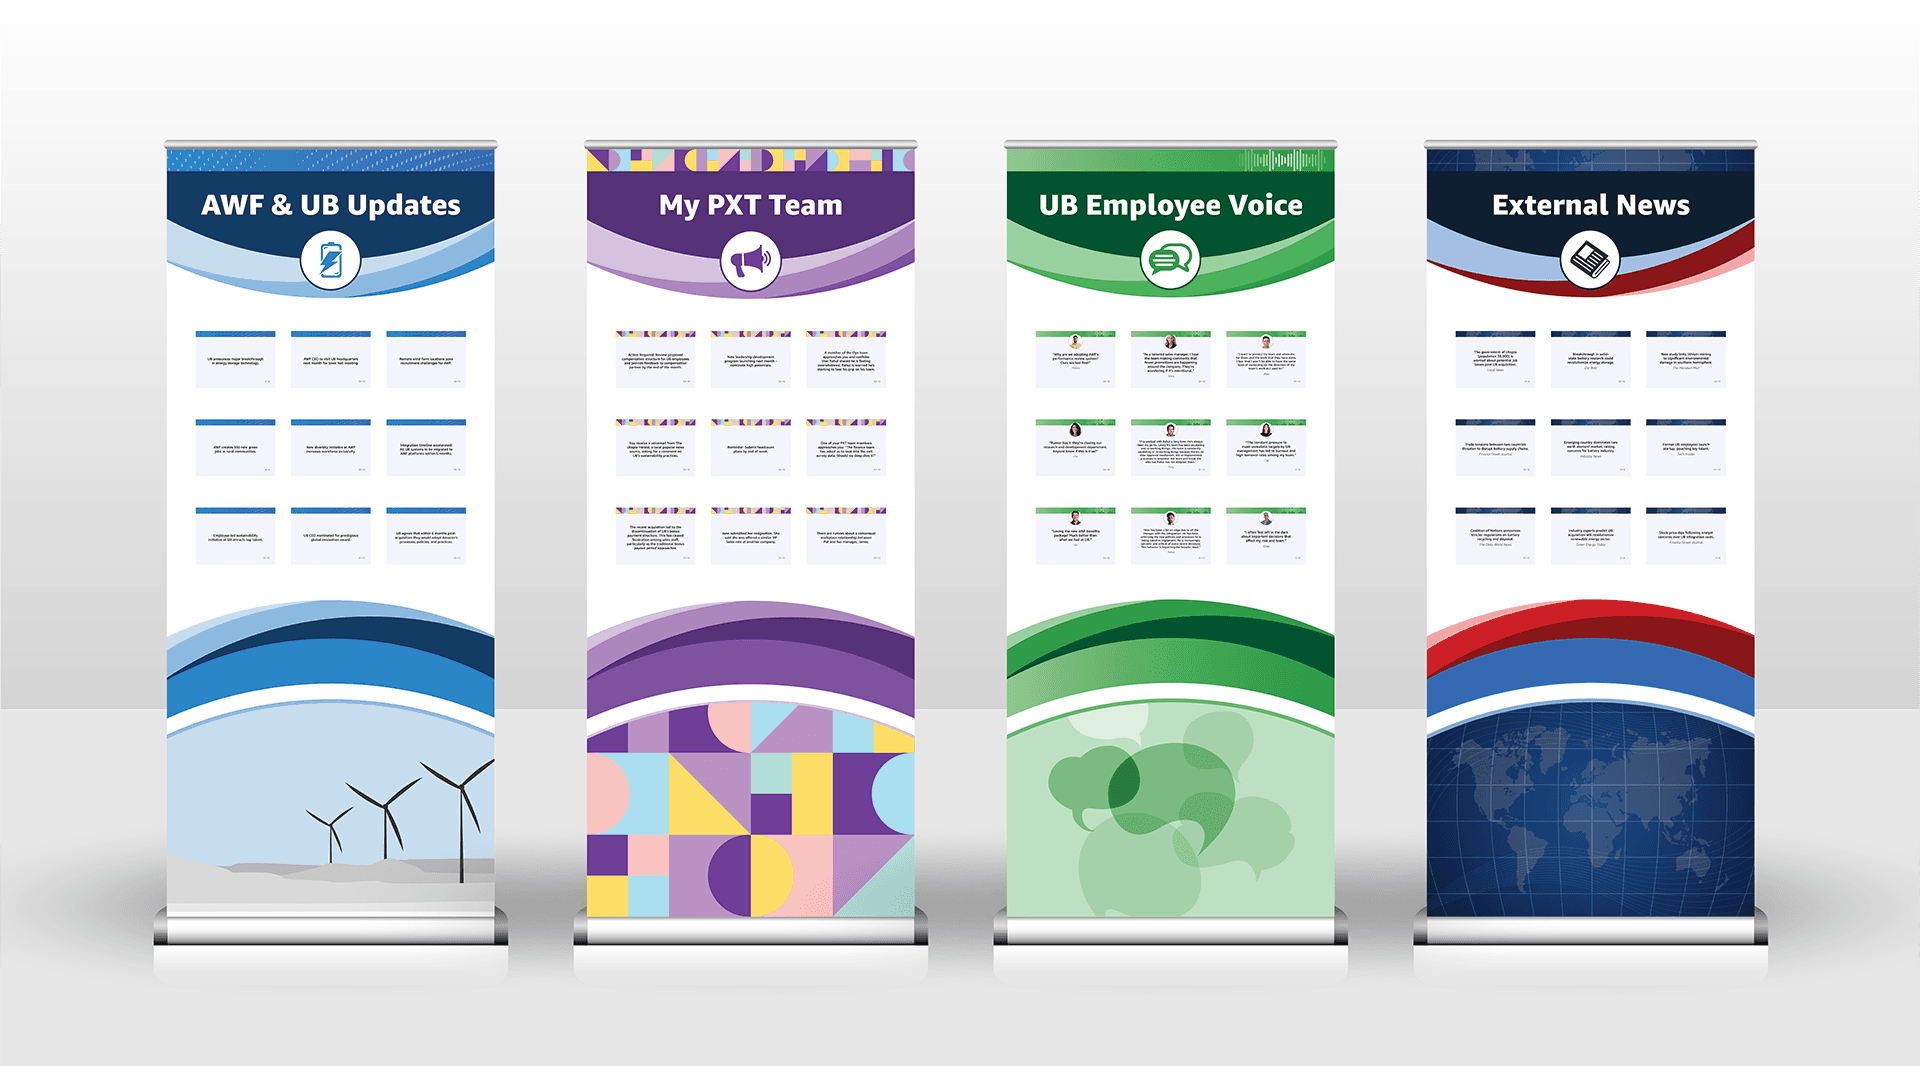
These four banners were designed for a leadership workshop where L7 leaders worked through a case study in groups. Throughout the session, facilitators placed content stickers on the banners in each corner of the room. These stickers introduced new information that forced groups to rethink and pivot their approach. Each banner represented a different category of information, color-coded for quick orientation.
The pop-up banners were created in Illustrator, and the content stickers were produced in InDesign with small indicators in the bottom-left corner telling the facilitator which day and time of the workshop to place them. The InDesign files were organized by day and time to make the sticker sheets easy for facilitators to manage.
End-of-year “By the Numbers” infographic summarizing PXT Academy’s annual delivery, engagement, and impact metrics. The challenge was presenting a large volume of stats, scores, and facts in a format that feels scannable and visually engaging rather than overwhelming.

I frequently design visual frameworks to support facilitated learning content. These are often handed to me as text outlines or rough sketches from instructional designers. My role is to determine how to structure and present the information visually so it communicates clearly in context (typically projected on screen or printed in a participant guide).


Information hierarchy · Data visualization · Large-format print · Slide design · Visual frameworks · User-centered production design